Statistical analysis software serves as the validation engine for plantar pressure research. It is utilized to rigorously test biomechanical parameters—specifically Peak Pressure (PP), Pressure-Time Integral (PTI), and Full Width at Half Maximum (FWHM)—to determine if observed changes in gait are mathematically significant. By executing specific tests like independent sample t-tests or Mann-Whitney U tests, the software filters out random variance to confirm correlations between foot pressure patterns and critical outcomes, such as fall risk.
The Core Insight Collecting pressure data creates a description of how a person walks, but statistical software determines why it matters. It bridges the gap between raw measurements and clinical conclusions, ensuring that insights regarding stability or injury risk are based on proven correlations rather than anecdotal observation.
The Inputs: Key Biomechanical Parameters
Defining the Variables
Before analysis begins, the software must ingest specific quantitative metrics extracted from the gait cycle.
The primary reference highlights Peak Pressure (PP), Pressure-Time Integral (PTI), and Full Width at Half Maximum (FWHM) as the critical inputs. These metrics quantify the intensity, duration, and distribution of force applied to the ground.
Regional Segmentation
To increase granular accuracy, data is often pre-processed by dividing the foot into specific anatomical zones.
As noted in supplementary contexts, the foot is typically mapped into ten specific regions, including the hallux (big toe), lesser toes, and metatarsal heads. Statistical software does not just analyze the "whole foot"; it compares these specific zones to pinpoint exactly where biomechanical anomalies occur.
The Mechanism: Significance Testing
Selecting the Right Test
The core function of the software is to select and execute the appropriate hypothesis test based on the data distribution.
Commonly used methods include independent sample t-tests for normally distributed data and Mann-Whitney U tests or Wilcoxon signed-rank tests for non-parametric data. The software automates the complex mathematics required to compare these distributions.
Identifying Statistical Differences
The software evaluates whether differences between two groups (e.g., healthy vs. injured) are genuine or likely due to chance.
By calculating p-values and confidence intervals, the software identifies statistically significant differences within the gait data. This is the step that validates whether a specific intervention or condition has actually altered the patient's biomechanics.
Correlating Data to Clinical Risk
Beyond simple comparison, the software is used to establish predictive relationships.
Specifically, the primary reference notes the software's role in evaluating the correlation between plantar pressure parameters and the risk of falling. This transforms abstract pressure numbers into a predictive safety metric for patients.
Understanding the Trade-offs
Statistical Significance vs. Clinical Relevance
A common pitfall is assuming that a statistically significant result automatically equates to a meaningful clinical change.
Statistical software is extremely sensitive and may flag minute differences as "significant" if the sample size is large enough. You must interpret these outputs carefully to determine if the mathematical difference actually impacts the patient's quality of life or fall risk.
Data Isolation
Statistical software focuses heavily on numerical inputs, often stripping away the visual context of the movement.
While supplementary tools can generate visual reports and integrate 3D motion capture, pure statistical packages analyze the numbers in isolation. Relying solely on the statistics without referencing the visual biomechanical reports can lead to overlooking the physical mechanics driving the data.
Making the Right Choice for Your Goal
## How to Apply This to Your Project
- If your primary focus is Clinical Safety: Prioritize tests that establish correlations between Peak Pressure (PP) and fall risk to identify vulnerable patients.
- If your primary focus is Product Engineering: Utilize the regional segmentation data to assess how orthotic or footwear designs affect pressure distribution in specific zones like the metatarsal heads.
- If your primary focus is Research Validation: Ensure you select the correct test (t-test vs. Mann-Whitney) based on your data distribution to ensure your conclusions are scientifically defensible.
Effective analysis requires treating statistical software not as a calculator, but as a filter for truth in complex biomechanical data.
Summary Table:
| Metric/Process | Description | Clinical Significance |
|---|---|---|
| Key Parameters | PP (Peak Pressure), PTI, FWHM | Quantifies intensity and duration of foot force. |
| Regional Mapping | 10 Anatomical Zones (Hallux, Metatarsals, etc.) | Pinpoints specific biomechanical anomalies. |
| Statistical Tests | T-tests, Mann-Whitney U, Wilcoxon | Validates if gait changes are mathematically significant. |
| Risk Correlation | Predictive Modeling | Links pressure patterns directly to patient fall risk. |
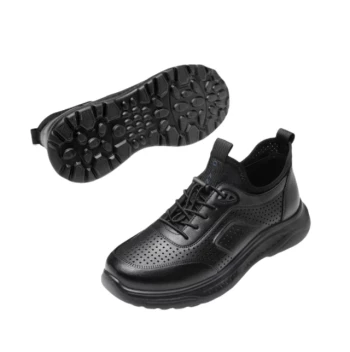
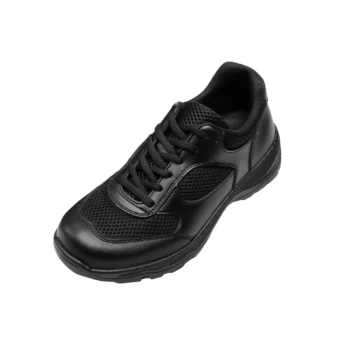
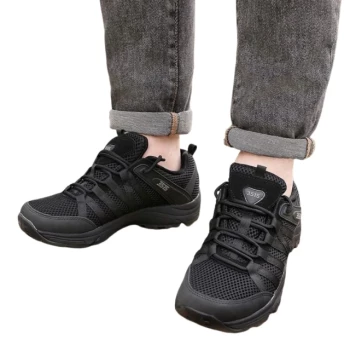
Partner with 3515 for Advanced Footwear Solutions
As a large-scale manufacturer serving distributors and brand owners, 3515 offers comprehensive production capabilities for all footwear types, anchored by our flagship Safety Shoes series. Our extensive portfolio covers work and tactical boots, outdoor shoes, training shoes, and sneakers, as well as Dress & Formal shoes to meet diverse bulk requirements. We bridge the gap between biomechanical research and high-performance manufacturing, ensuring every pair meets rigorous safety and comfort standards.
Ready to elevate your product line with precision-engineered footwear?
Contact Us Today to Discuss Your Bulk Requirements
References
- Yifeng Yan, Zhuoming Chen. Plantar pressure and falling risk in older individuals: a cross‐sectional study. DOI: 10.1186/s13047-023-00612-4
This article is also based on technical information from 3515 Knowledge Base .
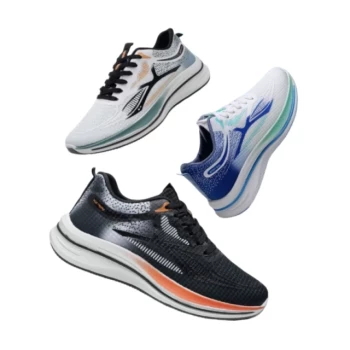
Related Products
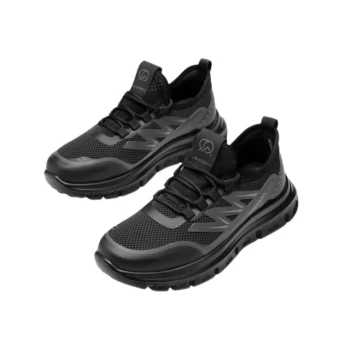
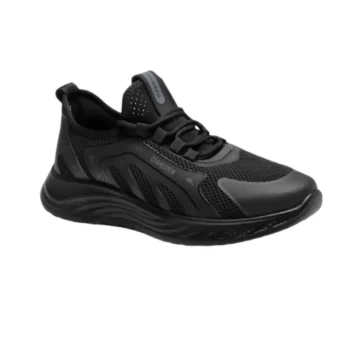
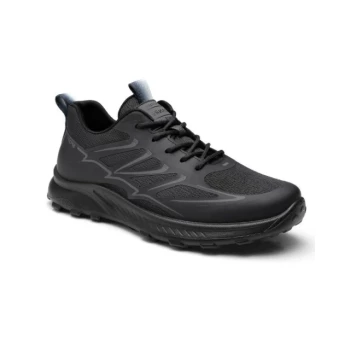
- Lightweight Breathable Sneakers with Wet-Traction Grip for Wholesale & Private Label
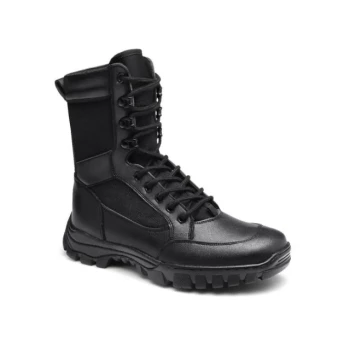
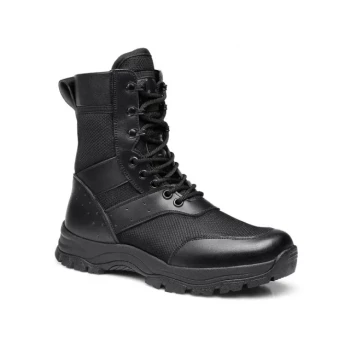
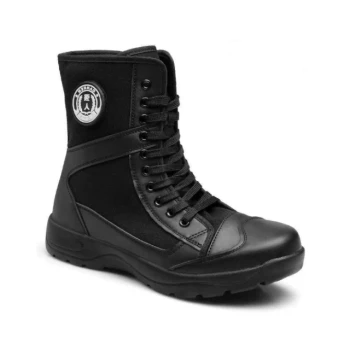
- Wholesale Durable Safety Boots Manufacturer Customizable Steel Toe Work Boots
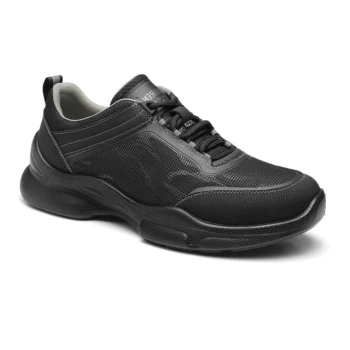
- Wholesale Durable & Breathable Training Shoes for Custom Brands
- Lightweight Breathable Training Shoes for Wholesale & Custom OEM Manufacturing
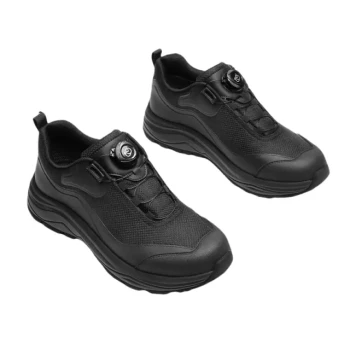
- Wholesale Breathable Athletic Sneakers - Custom Lightweight Cushioned Footwear Manufacturer
People Also Ask
- What are the style advantages of lightweight shoes? Sleek, Versatile & Modern Comfort
- Why are breathable sneakers necessary for tropical commuting? Stay Cool and Dry in High Humidity
- Why are lightweight breathable safety sneakers recommended for management personnel in precast production workshops?
- What are the benefits of wearing lightweight shoes? Reduce Fatigue & Boost Comfort for Work & Play
- How do lightweight shoes provide support? The Science of Efficient Cushioning & Stability