A 3D measurement microscope functions as a critical bridge between physical texture and quantifiable data. It contributes to surface roughness analysis by utilizing optical scanning technology to generate precise, three-dimensional profile maps of a substrate. This process allows for the calculation of the arithmetic mean roughness (Ra), providing a definitive metric for surface characterization.
By transforming surface topography into actionable data, 3D measurement microscopes enable the precise optimization of material interactions. This analysis is fundamental for designing surfaces that require specific friction profiles across diverse environments.
The Mechanics of Surface Characterization
Optical Scanning Technology
The foundation of this analysis lies in optical scanning. Unlike stylus-based methods that drag a tip across a surface, this optical approach captures data without physical contact.
This ensures the substrate remains unaltered during the measurement process, preserving the integrity of the surface features being analyzed.
Generating 3D Profile Maps
The microscope does not simply capture a flat image; it creates a three-dimensional profile map.
This map visualizes the peaks and valleys of the substrate, allowing researchers to see the true topography of the material. It provides a depth of detail that 2D imaging cannot offer.
Calculating Arithmetic Mean Roughness (Ra)
Once the profile is mapped, the system calculates the Arithmetic Mean Roughness (Ra).
This is a standardized metric representing the average deviation of the roughness profile from the mean line. It converts complex visual data into a single, comparable number.
Applied Analysis: Friction and Adhesion
Understanding Microscopic Interactions
The data derived from 3D microscopy reveals how surface textures interact with microscopic attachment features.
This insight is vital for understanding mechanical interlocking at a micro-scale. It explains why certain materials grip effectively while others slip.
Optimizing Outsole Patterns
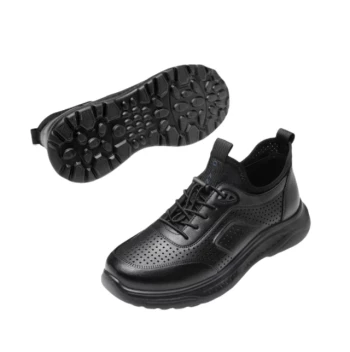
A primary application of this technology is the optimization of outsole patterns (such as shoe soles).
Researchers use the roughness data to design patterns that maximize the friction coefficient. This ensures the product performs as intended, providing safety and performance.
Handling Extreme Variations
The technology is versatile enough to analyze a full spectrum of textures.
It is effective for characterizing both extremely rough and extremely smooth surfaces. This range is essential for developing versatile products meant to function on varying terrains.
Critical Considerations for Data Interpretation
The Limitations of Averages
While Arithmetic Mean Roughness (Ra) is a standard metric, it is an average value.
An average can sometimes obscure distinct features, such as deep valleys or sharp peaks, that significantly impact performance. Reliance on Ra alone, without reviewing the 3D map, may lead to an incomplete understanding of the surface.
Contextualizing the Data
Roughness data cannot be analyzed in a vacuum.
To be valuable, the roughness metrics must be correlated with performance outcomes, such as friction coefficients. Data without the context of the physical interaction (e.g., shoe against pavement) offers limited utility.
Leveraging Data for Material Design
To maximize the value of a 3D measurement microscope in your analysis, align your approach with your specific engineering goals.
- If your primary focus is maximizing grip and traction: Prioritize the analysis of the 3D profile maps to visualize how outsole patterns mechanically interlock with the substrate's specific texture.
- If your primary focus is standardizing quality control: Rely on the Arithmetic Mean Roughness (Ra) calculation to establish a consistent, numerical baseline for comparing batches or different materials.
True surface optimization occurs when you combine quantitative metrics with a visual understanding of topography.
Summary Table:
| Feature | Description | Benefit |
|---|---|---|
| Optical Scanning | Non-contact data acquisition | Preserves substrate integrity without damage |
| 3D Profile Maps | Visualizes peaks and valleys | Provides deeper topographical detail than 2D imaging |
| Ra Calculation | Arithmetic Mean Roughness metric | Standardizes complex data into a comparable number |
| Micro-Scale Insight | Analyzes attachment features | Optimizes mechanical interlocking for better grip |
Elevate Your Product Performance with 3515 Footwear Expertise
As a large-scale manufacturer serving distributors and brand owners, 3515 leverages advanced material science to ensure superior product quality. Our comprehensive production capabilities cover all footwear types—from our flagship Safety Shoes series and tactical boots to outdoor, training, and formal dress shoes.
By partnering with us, you gain access to our extensive footwear portfolio and technical insights that ensure your bulk requirements meet the highest standards of safety and performance.
Ready to optimize your footwear line? Contact us today to discuss how our manufacturing excellence can support your brand's growth.
References
- Julian Thomas, Thies H. Büscher. Influence of surface free energy of the substrate and flooded water on the attachment performance of stick insects (Phasmatodea) with different adhesive surface microstructures. DOI: 10.1242/jeb.244295
This article is also based on technical information from 3515 Knowledge Base .
Related Products
- Lightweight Breathable Sneakers with Wet-Traction Grip for Wholesale & Private Label
- Wholesale Comfortable Business Casual Shoes Custom Manufacturing
- Lightweight Breathable Training Shoes for Wholesale & Custom OEM Manufacturing
- Wholesale Durable Safety Boots Manufacturer Customizable Steel Toe Work Boots
- Wholesale Durable & Breathable Training Shoes for Custom Brands
People Also Ask
- What are the benefits of wearing lightweight shoes? Reduce Fatigue & Boost Comfort for Work & Play
- How do lightweight shoes contribute to healthier feet? Reduce Fatigue & Prevent Foot Problems
- Why is breathability important in shoes for all-day wear? Prevent Sweat, Blisters, and Fatigue
- How do lightweight shoes provide support? The Science of Efficient Cushioning & Stability
- What are the style advantages of lightweight shoes? Sleek, Versatile & Modern Comfort