3D biomechanical analysis software acts as the computational bridge between raw sensor data and actionable safety insights. Its primary function is to integrate kinetic data from force plates with kinematic data from motion capture systems, employing advanced filtering algorithms to process these signals into usable formats. By constructing multi-segment hybrid models, the software automatically calculates critical safety metrics, specifically joint reaction forces (JRF) and the dynamic relationship between the center of pressure (COP) and center of mass (COM).
The core value of this software is its ability to reveal correlations between stability parameters and load responses. This provides the scientific evidence necessary to optimize safety shoe features, such as arch support and outsole grip, for challenging environments like inclines.
From Raw Signals to Digital Models
Data Integration and Signal Processing
Research into walking safety relies on multiple data streams. The software functions as a central hub, synchronizing kinetic data (forces) with kinematic data (motion).
To ensure accuracy, the software employs specific filtering algorithms. These algorithms strip away signal noise, ensuring that the subsequent analysis is based on clean, reliable data points.
3D Reconstruction and Tracking
Before analysis can begin, the software must digitize the physical movement. It handles the automated tracking and 3D reconstruction of raw coordinate data collected by motion capture systems.
This process builds multi-segment hybrid models of the human body. These models allow researchers to isolate specific body segments to understand how an incline affects movement mechanics.
Calculating Critical Safety Metrics
Quantifying Stability (COP vs. COM)
A primary function of the software in safety research is calculating the distance between the Center of Pressure (COP) and the Center of Mass (COM).
On an incline, the gap between these two points is a definitive indicator of stability. A larger or erratic distance often signals a loss of balance, helping researchers pinpoint exactly when and why a slip might occur.
Measuring Joint Stress (JRF)
Beyond balance, the software calculates Joint Reaction Forces (JRF). This metric quantifies the internal load placed on joints (such as the ankle or knee) during an incline walk.
By analyzing JRF, researchers can determine if specific footwear designs successfully mitigate physical stress or if the incline generates dangerous load spikes.
Visualizing Complex Data
The software converts these dense mathematical datasets into intuitive biomechanical charts and standard indices, such as the Gait Deviation Index (GDI).
This visualization allows technicians to quickly identify abnormal gait patterns. It transforms abstract numbers into visual evidence that informs design decisions.
Understanding the Limitations
Dependency on Data Quality
While the software is powerful, it is not a magic solution for poor data collection. The accuracy of the multi-segment models depends entirely on the precision of the input data.
If the motion capture markers are occluded or the force plates are improperly calibrated, the software's filtering algorithms may not be able to correct the errors. This can lead to misleading calculations regarding JRF or stability margins.
Interpretation Complexity
The software produces correlations, but it does not determine causality on its own. The "scientific basis" it provides requires expert interpretation to distinguish between a natural gait adjustment and a safety risk.
Making the Right Choice for Your Goal
To effectively utilize 3D biomechanical analysis for incline safety, align your focus with the specific output metrics provided by the software.
- If your primary focus is footwear stability: Prioritize the analysis of the COP-to-COM distance, as this directly correlates to the effectiveness of outsole grip and balance retention.
- If your primary focus is injury prevention: Concentrate on Joint Reaction Forces (JRF) and GDI to identify how arch support designs modify internal joint loading during incline walking.
By leveraging these automated calculations, you move from observing gait to scientifically engineering safer movement.
Summary Table:
| Core Function | Description | Key Metric/Output |
|---|---|---|
| Data Integration | Synchronizes kinetic force data with kinematic motion capture | Cleaned & Filtered Signal Data |
| 3D Modeling | Constructs multi-segment hybrid digital body models | Isolated Segment Mechanics |
| Stability Analysis | Tracks relationship between Center of Pressure & Center of Mass | COP-COM Distance Index |
| Load Assessment | Calculates internal stress on ankles, knees, and hips | Joint Reaction Forces (JRF) |
| Visualization | Converts mathematical datasets into intuitive gait charts | Gait Deviation Index (GDI) |
Engineer Safer Footwear with 3515
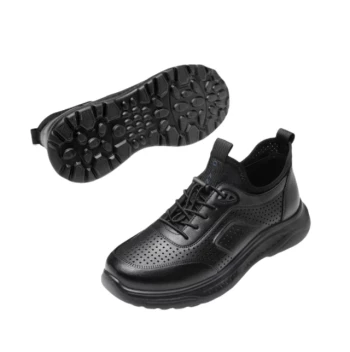
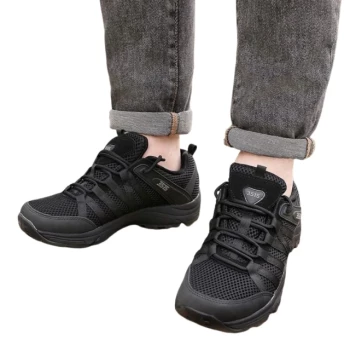
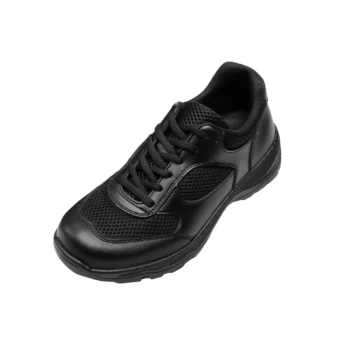
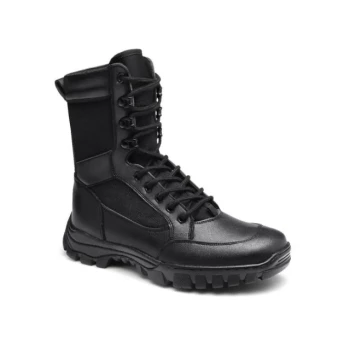
As a leading large-scale manufacturer serving global distributors and brand owners, 3515 leverages scientific data to refine our footwear engineering. Our comprehensive production capabilities cover everything from Safety Shoes and Tactical Boots to Training Shoes and Dress & Formal styles.
Whether you are looking for superior outsole grip for incline stability or advanced arch support to mitigate joint stress, we provide the manufacturing excellence you need to protect your customers.
Ready to elevate your product line? Contact us today to discuss your bulk requirements.
References
- Noor Arifah Azwani Abdul Yamin, Hiroshi Takemura. Correlation between Postural Stability and Lower Extremity Joint Reaction Forces in Young Adults during Incline and Decline Walking. DOI: 10.3390/app132413246
This article is also based on technical information from 3515 Knowledge Base .
Related Products
- Wholesale Durable Safety Boots Manufacturer Customizable Steel Toe Work Boots
- Lightweight Breathable Sneakers with Wet-Traction Grip for Wholesale & Private Label
- Lightweight Breathable Training Shoes for Wholesale & Custom OEM Manufacturing
- Wholesale Durable & Breathable Training Shoes for Custom Brands
- Durable High-Ankle Tactical Boots Wholesale Manufacturer for Custom & Bulk Orders
People Also Ask
- What are the advantages of steel toe work boots? Maximum Protection for Heavy-Duty Work
- What are some common myths about steel toe work boots? Debunked for Modern Workers
- What are the pros and cons of steel toe work boots? A Guide to Maximum Protection vs. Comfort
- What are the different types of steel toe work boots? Choose the Right Boot for Your Job
- What additional safety features do steel toe work boots often include? Beyond the Steel Toe Cap